The Framework for your Business Story
With the foundation blocks of your business’ financial story in place (see Related Posts below), we’re ready to put together the outline or framework of that story. The framework for the story of your business takes the form of the basic financial reports you design and read on a regular basis. The purpose of this article in our “Financial Carol” series is to introduce you to these six cornerstone financial reports and discuss how you use these to begin seeing (reading) the story of your business.
Monthly P&L
Let’s start with what is likely the most familiar report – the monthly P&L (Profit and Loss) report. The report can take various forms, but in its simplest form it reflects the income and expenses for the last calendar month.This report tells you the story of the immediate past and generally speaking might look like the report shown in Figure 1.
When you read this report each month, there is nothing you can do to change that immediate past, and hopefully there are no big surprises (depending on other reports you have (e.g., sales forecast) and the direct updates from key leaders. With no other context than the monthly view of your financials, there is very little to gain in business perspective and generally either just makes you smile or brings anxiety.
The key to creating a monthly P&L report that provides expanded perspective is adding additional data that provides context. Examine Figure 2 which is an enhanced Monthly P&L report.
This improved version presents context by adding four additional reporting elements – budget, variances, contextual reporting periods, and a YTD component. The first two additions are the planned budget amounts for each account and totals along with the variances based on the current month’s results. Viewing a current result without knowing how this compares against your original budget provides you zero perspective on managing outcomes. With the budget included, along with variances which quickly highlight any specific GL accounts where there the results vary greatly from the budget, you now have useful information.
The third improvement is the addition of context by adding other monthly results for comparison. This examine brings in data from the prior month, and for the same month in the prior fiscal year. This again expands your story and allows you to compare changes (short term trend) using context.
The fourth improvement, and one that I have found extremely important, is adding a YTD summary for the same time period. Examining one month out of context may end up highlighting the wrong data (e.g., temporary AR delays, unexpected AP payment, short-term slump in sales or a vacation of a key sales person) but having the YTD data included provides the larger context of your progress throughout the year.
Sidebar – Percentages
The last piece of the monthly P&L (and any financial report) is the inclusion of percentages. A future post is going to cover that in full, so for now, I am going to skip that discussion.
- Ensure you have a completed budget so that budget and variances will appear on your P&L
- Include last month’s data and a variance column for comparison
- OPTIONALLY – if you expect your business to have specific trends year over year, consider adding “same month last year” for comparison.
- Include a YTD component for the data period (YTD current month) as well as last year YTD (same period) and variances
You will use the monthly P&L report to:
- reconcile the most recent month and fully understand that month’s story (what happened).
- make immediate comparisons (variance analysis) to prior month and/or prior year to determine if further inquiry is needed into possible trends or anomalies.
- ensure the actual month’s results are added to your ongoing 12-month P&L forecast (automatically or manually) – we will discuss that report shortly.
Annual Budget
I did not put this first, because I wanted you to first read the significance of having this information available for your monthly P&L. Without a budget you are a blind leader when it comes to managing outcomes. Regardless of how much reality vs. guesswork you must put in a budget (depending on the age, market conditions, and/or trajectory of your business), a completed budget is an absolute MUST to set expectations and goals for yourself and your team.
Figure 3 provides an example of an annual budget.
Figure 3 provides a sample 12 Month P&L Budget. If you do not have a budget, this may seem overwhelming, but I can promise you this is a straightforward process. You can use this basic outline of activities to create your budget:
- Most software programs (and certainly any external financial provider) can easily allow you to begin building a budget by copying the actual results (and any remaining “budget” months) in the current year. For example, if I wanted to create a 2017 budget in November of 2016, the initial data for the 2017 budget would be the 2016 actuals for each month – January through October – along with the current 2016 budgets for November and December. Either your software or your accountant can provide this “starting” framework.
- To begin shaping that budget, start with revenue. Using whatever method that can best determine your revenue trajectory (e.g., historical patterns, reports form sales team, forecast reports, new product launch expectations, pricing changes) enter the expected revenue for each month of the new budget year.
- After revenue, consider any changes in direct expenses (normally these are variable and directly related to revenue) that must be adjusted based on your revenues. If you are selling more products, you may have additional production, shipping, commissions, etc. If you are selling more services, there may be additional expenses for outside contractors, or new internal hires. The goal is to correctly align any direct expenses that typically follow revenue.
- The next step is to adjust your overheads/fixed types of expenses. You may have increases in rent, salaries (due to raises), new employees required, marketing costs, or any other expense that may increase or decrease based on some predictable factor.
- The final step is to take a look at the profit and margin this budget is going to deliver. If this does not reflect what you believe is reasonable and acceptable, then go back to the revenue budgeting and work your way through the process again refining the budget.
Your budget is your ultimate guide. Your budget is the basic plot to your story. What happens after that is the story that develops around that plot or even changes the plot. As a business leader, it does not make sense to manage without a budget.
Below is a list of the basic elements you should make sure are present in your annual budget report (see the sample provided in Figure 3 above).
- Monthly budget details for all 12 months in your fiscal year
- Totals for the year along with at least the Actual Totals from the previous year and variances (and perhaps even the past two years with variances)
- Key percentages (as noted, will cover the significance of percentages in my next article in this series).
- An FTE analysis (full-time-equivalent headcount analysis) – Every full-time employee represents one FTE and part-time and contract employees should be converted into FTE by the total hours worked (one FTE for every 160-hour work month).
You will use the annual 12-month P&L budget report to:
- engage key leaders in setting goals (during process of creating budget).
- plan as accurately as possible for coming year.
- share with your team to communicate expectations, goals, and what success will look like in the coming year (give them a target to keep in mind).
- finalize sales forecasts and commission/bonus plans.
- prepare Initial cash flow analysis to evaluate current funding.
12-Month P&L Forecast
Once you have your budget, you have the basic format required for maintaining an accurate forecast. As the months pass in your fiscal year, your forecast will be identical in format to your budget, but contain prior month actuals and then the future “budgeted” or “forecasted” months results. This allows you to easily track the change to the original budget as the year progresses. Figure 4 is a sample of a forecast that might occur after Q3 of your fiscal year (end of August in this sample).
At a minimum, you should be examining and updating your forecast on a quarterly basis to give yourself the opportunity to be proactive in making adjustments to handle increasing or decreasing expectations in revenues and profits.
You will use the 12-month P&L Forecast to:
- get a full view of what is actually transpiring or unfolding as the truth in your business during the year.
- manage expectations as the story unfolds.
- identify and analyze emerging trends that need attention.
- proactively alter future forecasted (what was your original budget) to reflect changes that you anticipate or changes you should make.
- ensure that actual and future data is accurate which also ensures that your predictions of cash flows is accurate (you don’t want cash related surprises).
Sales Forecast
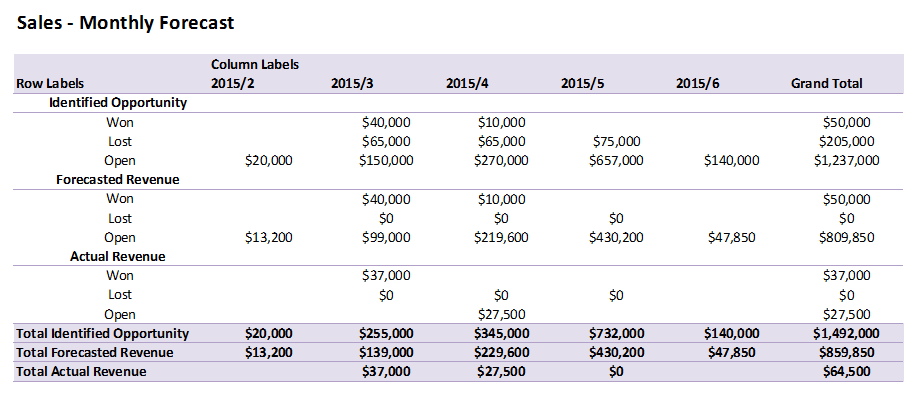
Proactively managing your overall P&L forecast and your sales process and/or team requires that you and your team build and maintain an accurate sales forecast. Sales forecasts can take many, many different forms (see Figure 5 for one example of an excel pivot table report). However, there are some key elements that you should keep in mind regardless of form.

Figure 5 – Sample Sales Forecast
Forward Looking
Any sales forecast should be forward looking. By that I mean it is certainly good to have some historical perspective, like YTD sales numbers, three months of historical detail (or all past months in your fiscal year), a comparison to last year’s sales numbers in the same period and YTD; however, your sales forecast must show you the next two or three months or even the remainder of your fiscal year as the current expected outlook from sales.
Closer to Reality than “hope”
If your business revenues are derived primarily from inbound sales, your role will be to watch trends, anticipate outside forces (e.g., seasonality, weather, market changes, competitive changes, returns, customer satisfaction, social media) to ensure you keep as much reality in your forecast as possible.
For businesses that rely heavily on “outbound” sales, you will be primarily be relying on individual sales people to provide the data to build your forecast. This introduces “hope” into the equation. Sales people generally include “hope” in their forecast due to their optimism, fear of sharing bad news, and their competitive nature. However, your job is to find the means (e.g., CRM system forecasts, discussions, key performance indicators) that bring as much reality to their forecasts as possible.
Make it Easy for Sales People
You want to make the process of sales forecasting as easy as possible for sales people. Most popular CRM systems have the sales forecast integrated into daily work. By that I mean that as sales people do their normal work of updating progress, identifying opportunities, estimating close dates, etc., the CRM solution itself can product a forecast for you based on what they are already putting in the system. If you use some other manual process (e.g., spreadsheet, or just notes from meetings), it is important for you to compile that data into a repeatable format and keep it current (as in Figure 5 example).
You will use your sales forecast to:
- maintain a reality check on future sales expectations against original budget/goals.
- identify larger opportunities so that you can offer assistance in closing as needed.
- identify problem areas (e.g., certain products not selling, certain sales people struggling).
- Generate discussion/coaching opportunities as needed.
- Keep 12-month P&L revenue forecast accurate in order to make proactive cost-structure changes as required.
Cash Flow Analysis
It is vital that you know your current and near-future cash position to make important short-term decisions (e.g., credit line use, funding, upcoming one-time payments). The most common method for this is using a cash flow analysis report (provided in popular software packages or one you create). Cash flow analysis requires great discipline in accounting. Figure 6 offers you a very basic sample of a cash flow analysis report.
While the concept is simple, to accurately create a cash flow report (see Figure 6 for an example), you must have the following:
- A P&L 12-month budget
- An accurate sales forecast that looks forward 2-3 months – minimum
- An accurate P&L 12-month forecast (maintaining actual and forecasted data)
- Up to date receivables (accurate invoice dates and expected cash receipt dates)
- Up to date payables (with expected payment dates)*
- Accurate accrued revenues for repeating revenue (e.g., monthly contracts)
* One special note on payables – One of the most common mistakes is not accurately recording one-time or annual recurring expenses in budgeting. In other words, you forget to record that annual property tax payment in the right month, insurance renewals in the right month, software subscription renewals, etc. or when you budget, you accidentally spread those costs out over the year equally and forget that the actual payment occurs in a single month. If you do spread out the costs, make sure you are accruing those funds into an account for payment and remember that excess cash is already “spent.” If you are not spreading out the costs, make sure the anticipated payment is in the correct month to avoid an unpleasant surprise.
You will use this report to:
- anticipate unusual cash requirements and investigate further.
- anticipate decisions on required funding (credit line, personal investment, shareholder investments).
- make investment decisions for excess cash.
- anticipate required business practice changes
A/R Aging Report
The last cornerstone report is the A/R (Accounts Receivable) Aging Report. If you don’t get paid, well, then what is the point of invoicing anyone. Right? I guarantee you that if you show me a business where they are having difficulties getting paid, the most likely contributor to that is a simple lack of focus on tracking the aging of invoices.
Figure 7 is a sample of a typical A/R Aging Report. This report shows the list of companies with an outstanding invoice and the “aging” or time period those past invoices fall into. You have invoices that are current (as expected), invoices that are not paid organized into time periods that might require different actions on your part (this sample uses 1-30 days, 31-60 days, 61-90 days, and over 90 days).

Figure 7 – Sample A/R Aging Report
The purpose of this report is that you get the right person or people to follow up with customers that are progressing further and further out on the aging timeline. Some customers just forget. Some customers conveniently forget. Some customers are having legitimate issues and a friendly conversation may nudge them in the right direction. The problems arise when you just print this report, have anxiety, but no one is focused on engaging with these customers early and often.
You will use this report to
- assign individuals (e.g., accounting, customer service, sales) that can best follow up with customers that are aging past desired limits.
- quickly identify customers where products/services should be “denied” until they are current in payments (sales will keep selling them stuff unless you make them stop!)
- avoid surprises by catching slow payers early and intervening
- Make decisions on long-term “bad debt” as necessary – e.g., write-offs)
Build and Use the Six Cornerstone Reports First
Those are the six cornerstone reports that you should make a priority. These reports, when used together provide the full framework for your story. What I mean is that these reports will provide the data that tells and retells your business story over time. The data represents facts, and the skill to learn is how to read these data points and interpret your story to manage your business. As this series continues, my goal is to offer you key insights to hone your financial story reading skills. Stay tuned.
Bonus – the 7th Report – P&L Summary Year over Year
One additional report that you will ultimately want to create is a year over year P&L Summary. Figure 8 is an example of a P&L Summary that provides a 5-year view (historical and current year) along with comparisons. This type of report is required when speaking with investors, board members, key directors/employees, or others that are stakeholders in your business. This same format can accommodate any number of years and even future years (when you want to look forward in the future of new products, acquisitions, or future organic growth). We will talk much more about this report when I cover the concept of “proformas” in a future post.


